Well-educated customers can use your product competently and efficiently in order to achieve their goals and make their lives and work easier.
The consequence of this is that those customers remain loyal to your product for many years and bring in the revenue you can use to grow your company.
However, it can be difficult to gauge just how effective your education methods are in helping users understand and operate the product.
Fortunately, some key performance indicators can tell if you’re on the right track or if you need to implement some changes.
In this article, we’ll tell you what these KPIs are and how you can track and interpret them.
Let’s start at the very beginning: product onboarding.
Onboarding Completion Rate
In SaaS business, customer education should always start with a strong onboarding process.
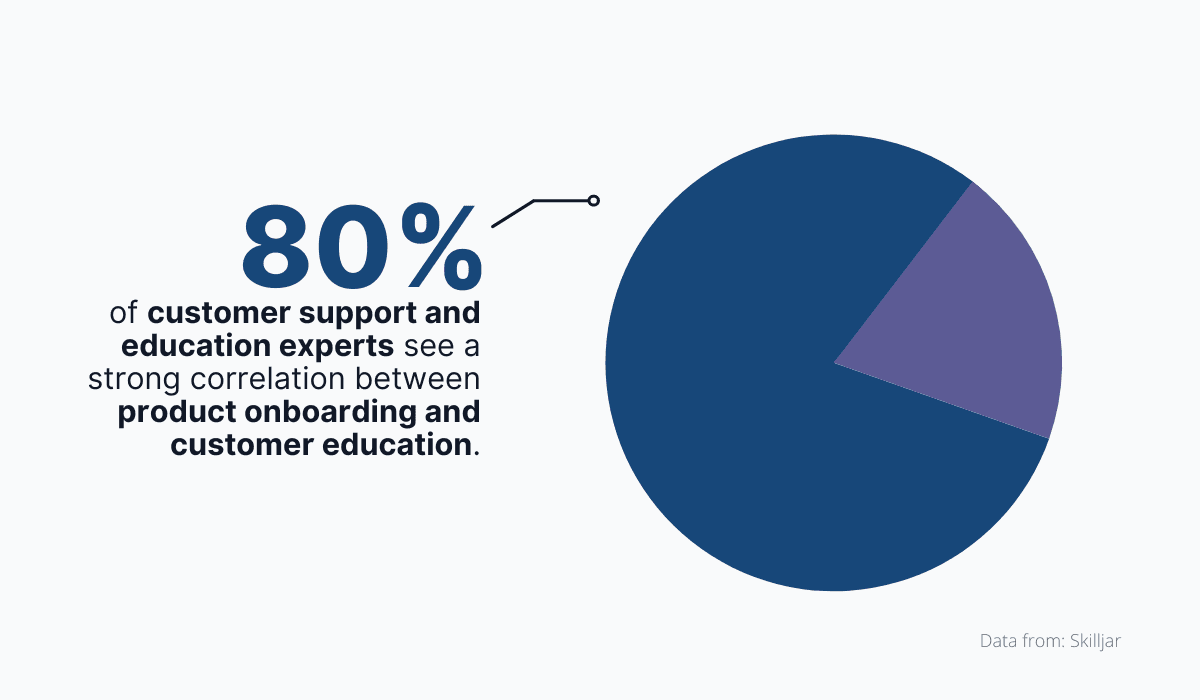
In fact, experts in the industry report that they have seen a strong correlation between customer education and product onboarding.
Source: Archbee
One metric that can help you measure how well the users are coping with your product onboarding process is the onboarding completion rate.
This metric looks at how many new users managed to complete the onboarding process, compared to the total number of users who attempted it.
Onboarding completion rate is, therefore, expressed as the percentage of users who have successfully completed the onboarding process.
Seems simple enough, but how do you actually mark the successful completion of onboarding?
That bit is somewhat more difficult but not impossible.
If you’re using product analytics software, you can divide your onboarding process into meaningful steps and then set up events to count every user who manages to trigger them.
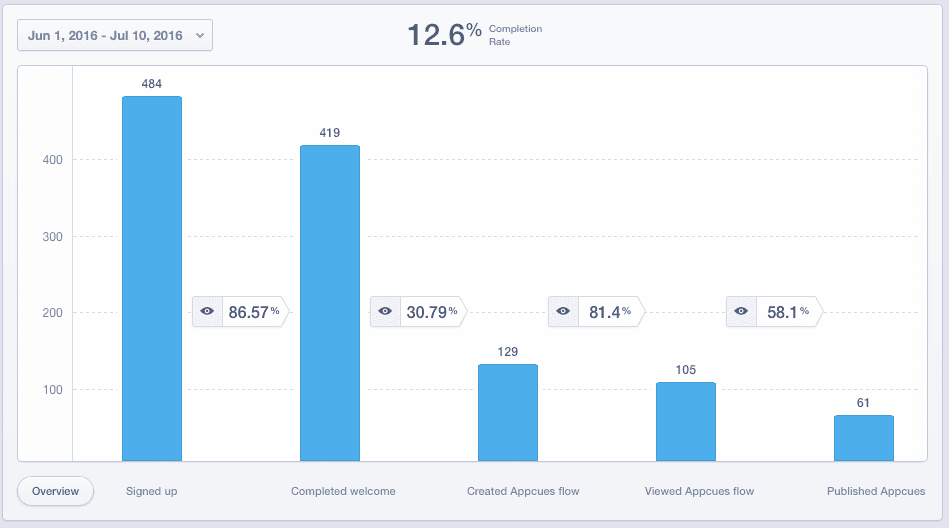
Here’s how that might look using Mixpanel:
Source: Appcues
The onboarding process for Appcues in Mixpanel has five steps, so the users who have triggered all of the steps can be said to have completed onboarding.
And as you can see, Mixpanel can even show you where the biggest number of drop-offs occurs (between steps two and three in this case), which gives you a solid starting point to improve the process.
Every improvement you make to the onboarding process will automatically mean that you’re also improving customer education, which is why the onboarding completion rate is a good indicator of how you’re educating your users.
Product Adoption Rate
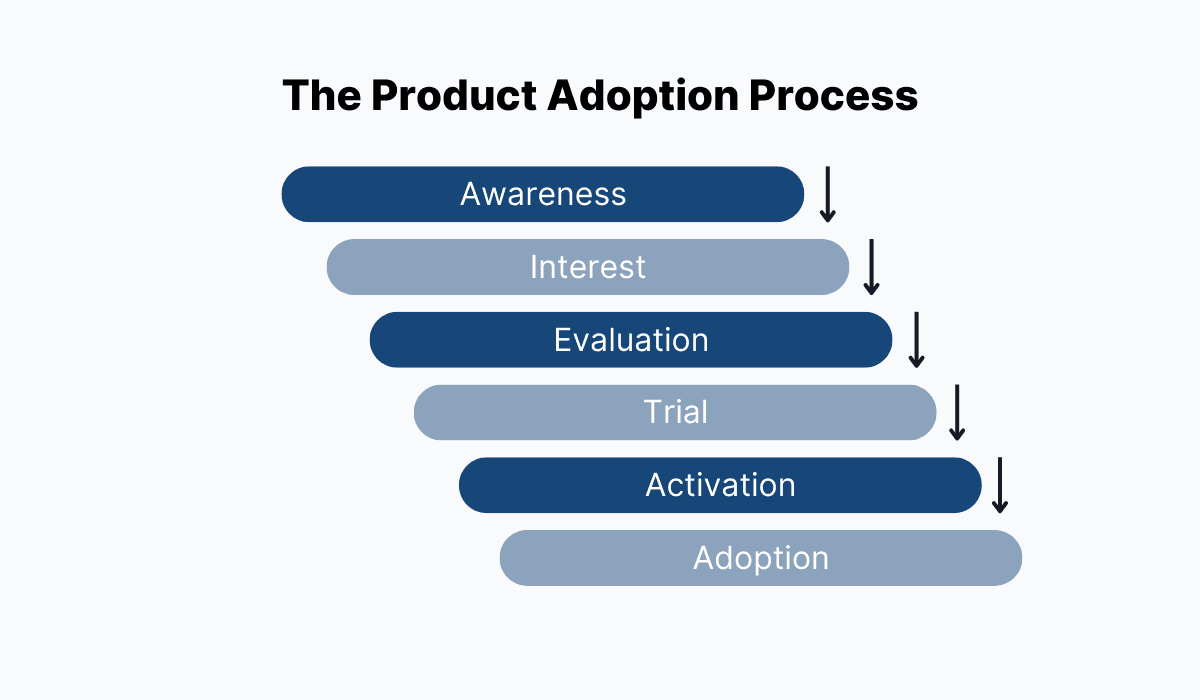
Product adoption is the process by which people who hear about your product for the first time become its regular users.
The process is divided into six stages, and with each stage, the user’s knowledge about your product and their capability to operate it increases.
Source: Archbee
Since each stage of the adoption process presupposes a higher level of knowledge and skill, we can definitely say that an unproblematic, steady progression through the process is a key performance indicator for a healthy customer education system.
Multiple metrics can enable you to track the adoption process, but the most straightforward one is the product adoption rate.
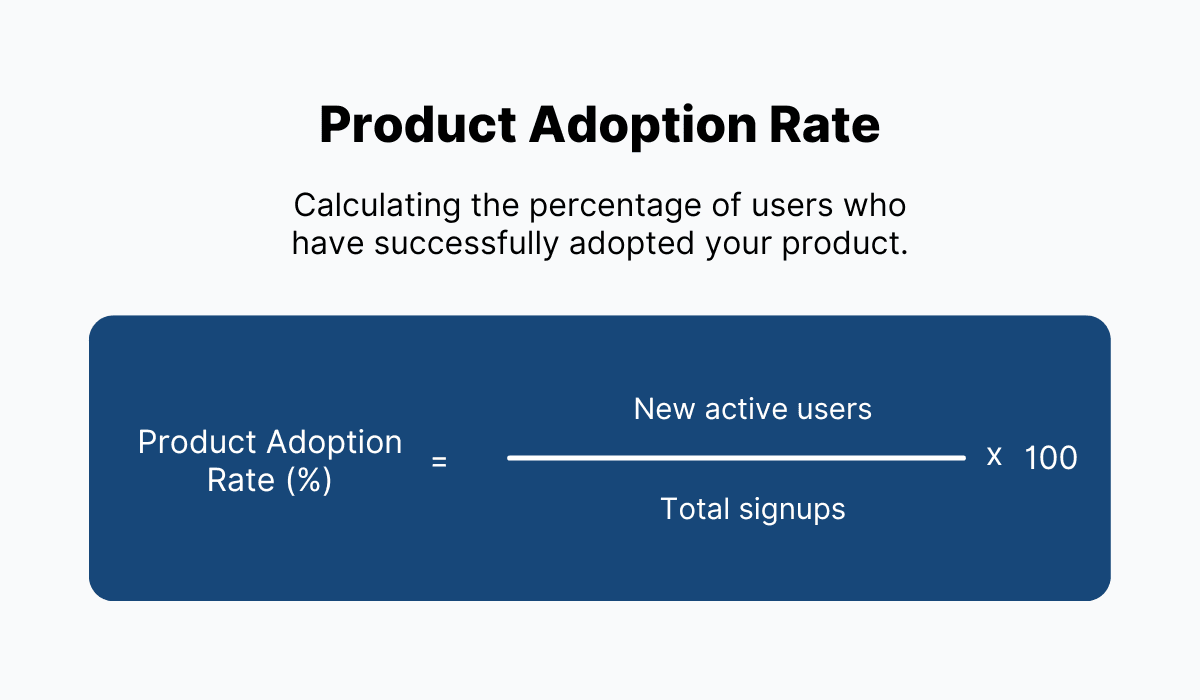
This is another percentage metric, and it’s calculated as the proportion of users who have adopted the product and use it regularly out of all signups in a given period.
Source: Archbee
Therefore, the data you need to calculate this metric includes your active users (users who access the product on a daily, weekly, or monthly basis) and the number of signups.
Both should be available in your product analytics reports.
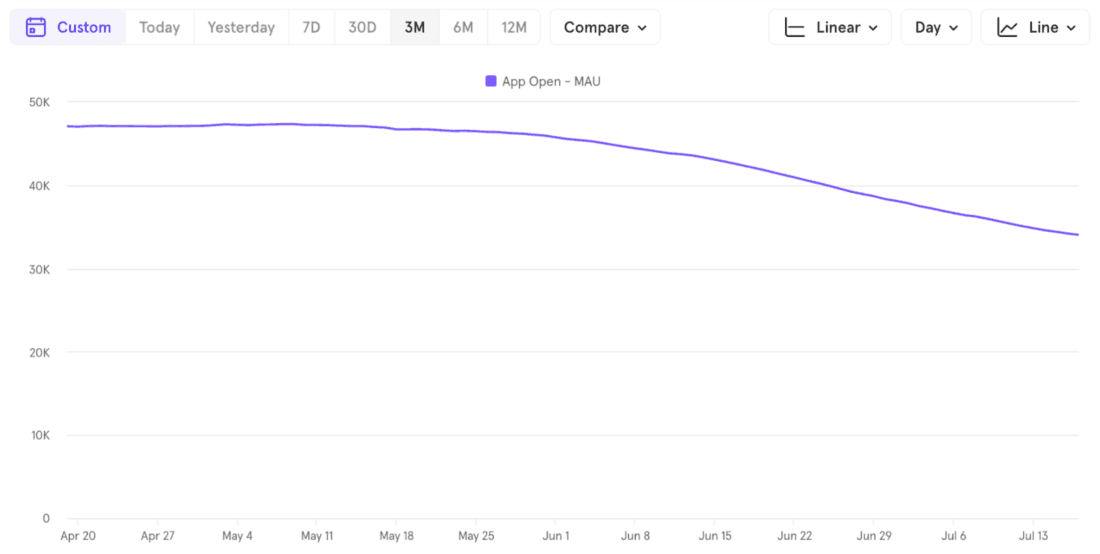
For example, in this report, the number of monthly users is diminishing over time:
Source: Mixpanel
If the number of signups hasn’t fallen for the same period, this probably indicates that users are having trouble adopting the software into their routine.
And that, in turn, points to the conclusion that this SaaS provider might not be educating users about the product’s value and correct use.
It’s clear that product adoption becomes very difficult without a focus on customer education, so keep an eye on adoption rates if you want to know how well you’re educating users.
Customer Retention Rate
Your responsibility toward your user doesn’t end once they’ve successfully adopted the product and integrated it into their work/life.
Customers can always change their minds and decide to go with another software option, and it’s a part of your mission to motivate them to keep using your service.
In other words, after product adoption is complete, you need to start working on customer retention.
But how do you retain customers in the long term?
Well, you can keep providing an excellent service while simultaneously working on expanding their use of the product and educating them on how to accomplish more with it.
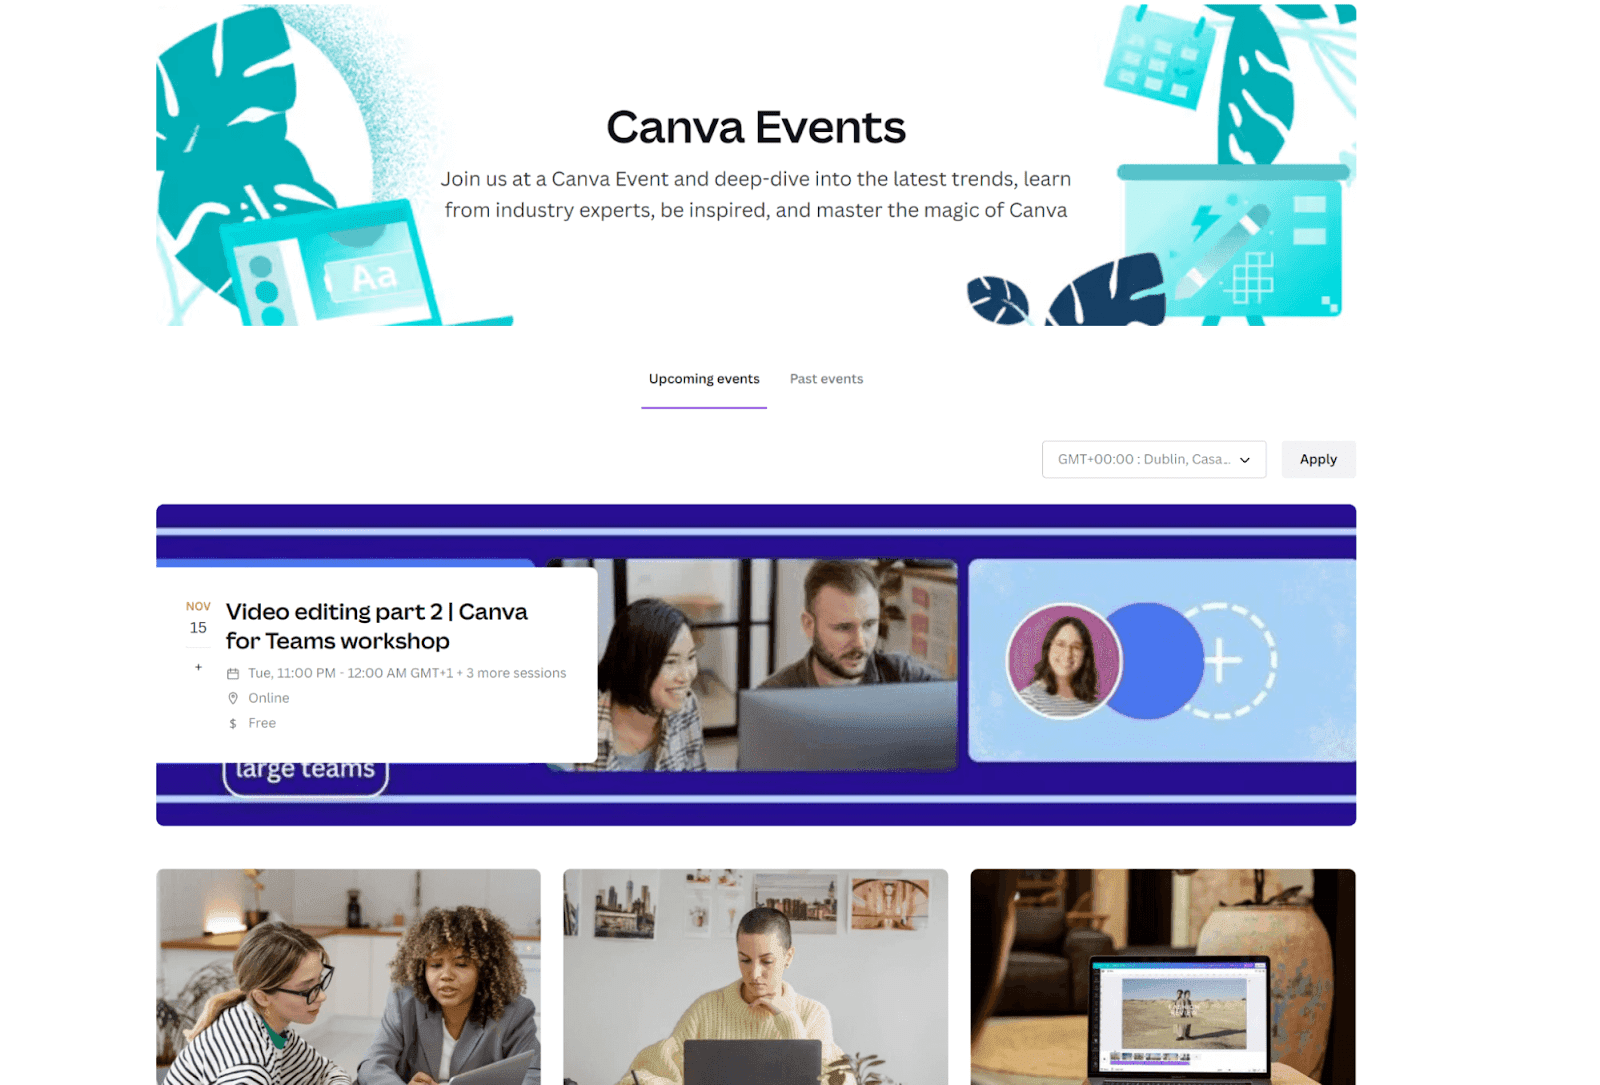
That’s why, for example, many SaaS companies offer webinars, product academies, and regular meetings with customer success reps.
These activities allow them to keep educating customers even after the onboarding and adoption processes are finished.
Source: Canva
In this way, customer retention is closely tied to customer education because the better you educate and support your existing users, the longer they will stay with you.
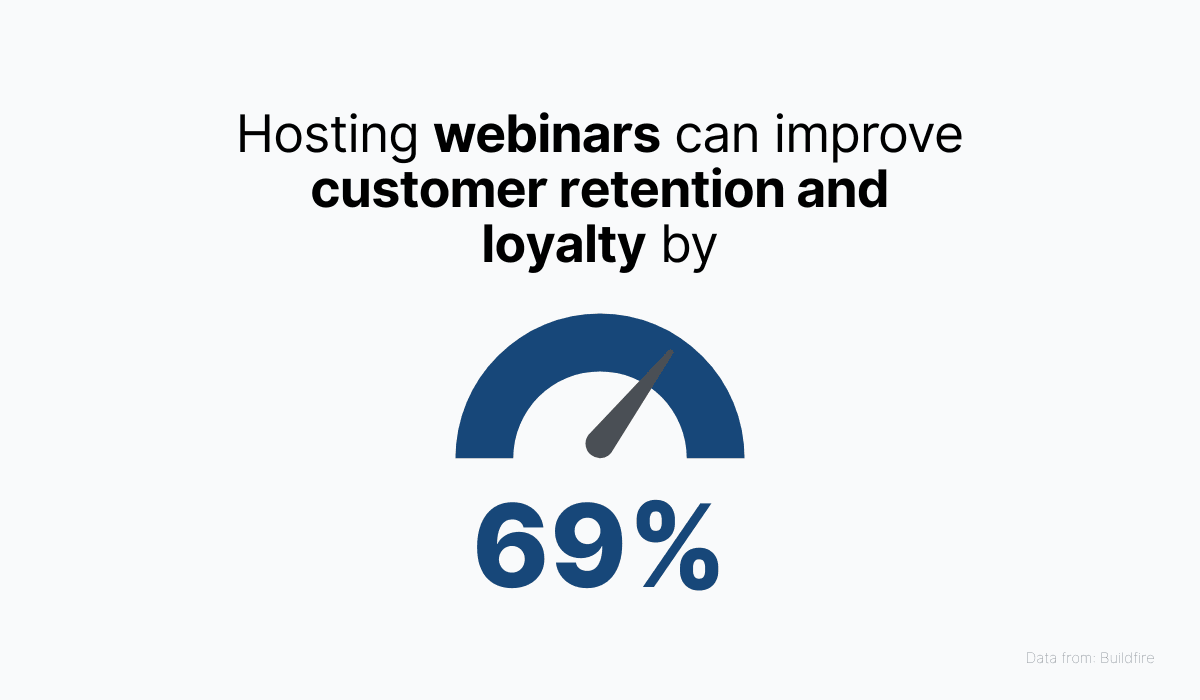
Research data supports this claim, especially where webinars are concerned.
Source: Archbee
Customer retention rate is another metric that’s easy enough to track. It’s the percentage of your users who stay with you after a given amount of time has passed.
Long story short, if you’re retaining customers for a long time, that’s a clear sign that you’re doing a good job educating users during their entire journey with you.
If, however, you notice retention rates falter, that could mean that you need to focus more on that aspect of your relationship.
Support Ticket Volume
Providing excellent customer support is paramount for running a successful SaaS business and definitely a focal point for investment.
However, having a customer base that’s too dependent on customer support reps can mean that you’re not educating your customers enough on product use and issue resolution.
For this reason, support ticket volume is another KPI for customer education.
A higher volume indicates lower education, while a low volume can be interpreted as a sign of knowledgeable users.
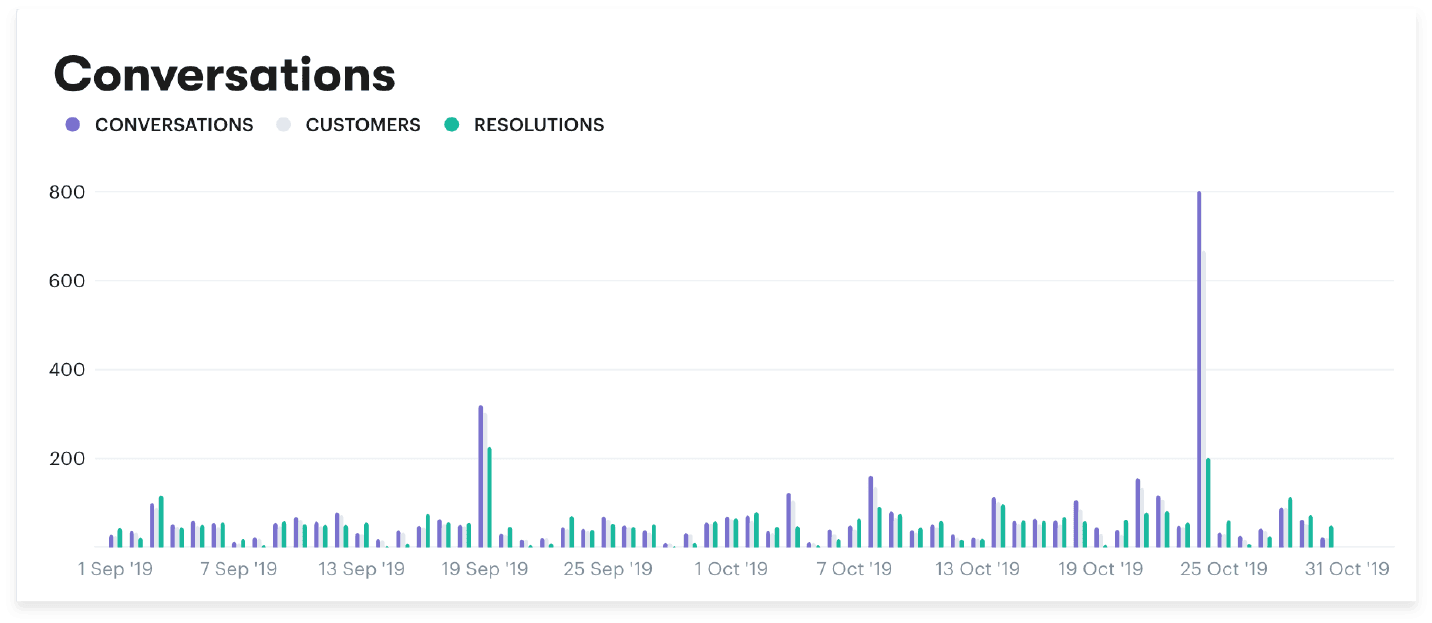
To find out where you stand with this metric, you can track the number of conversations with users needing assistance over time with customer satisfaction software, such as Groove.
Source: Groove
Emerging trends in ticket volume can tell you when you need to increase your efforts to educate users because the volume is rising, for example after the introduction of a new feature or a change to the interface.
You can also take a qualitative approach to the measurement and take a deep dive into call logs and email correspondences to find out what kinds of questions users are asking and whether some issues crop up more often than others.
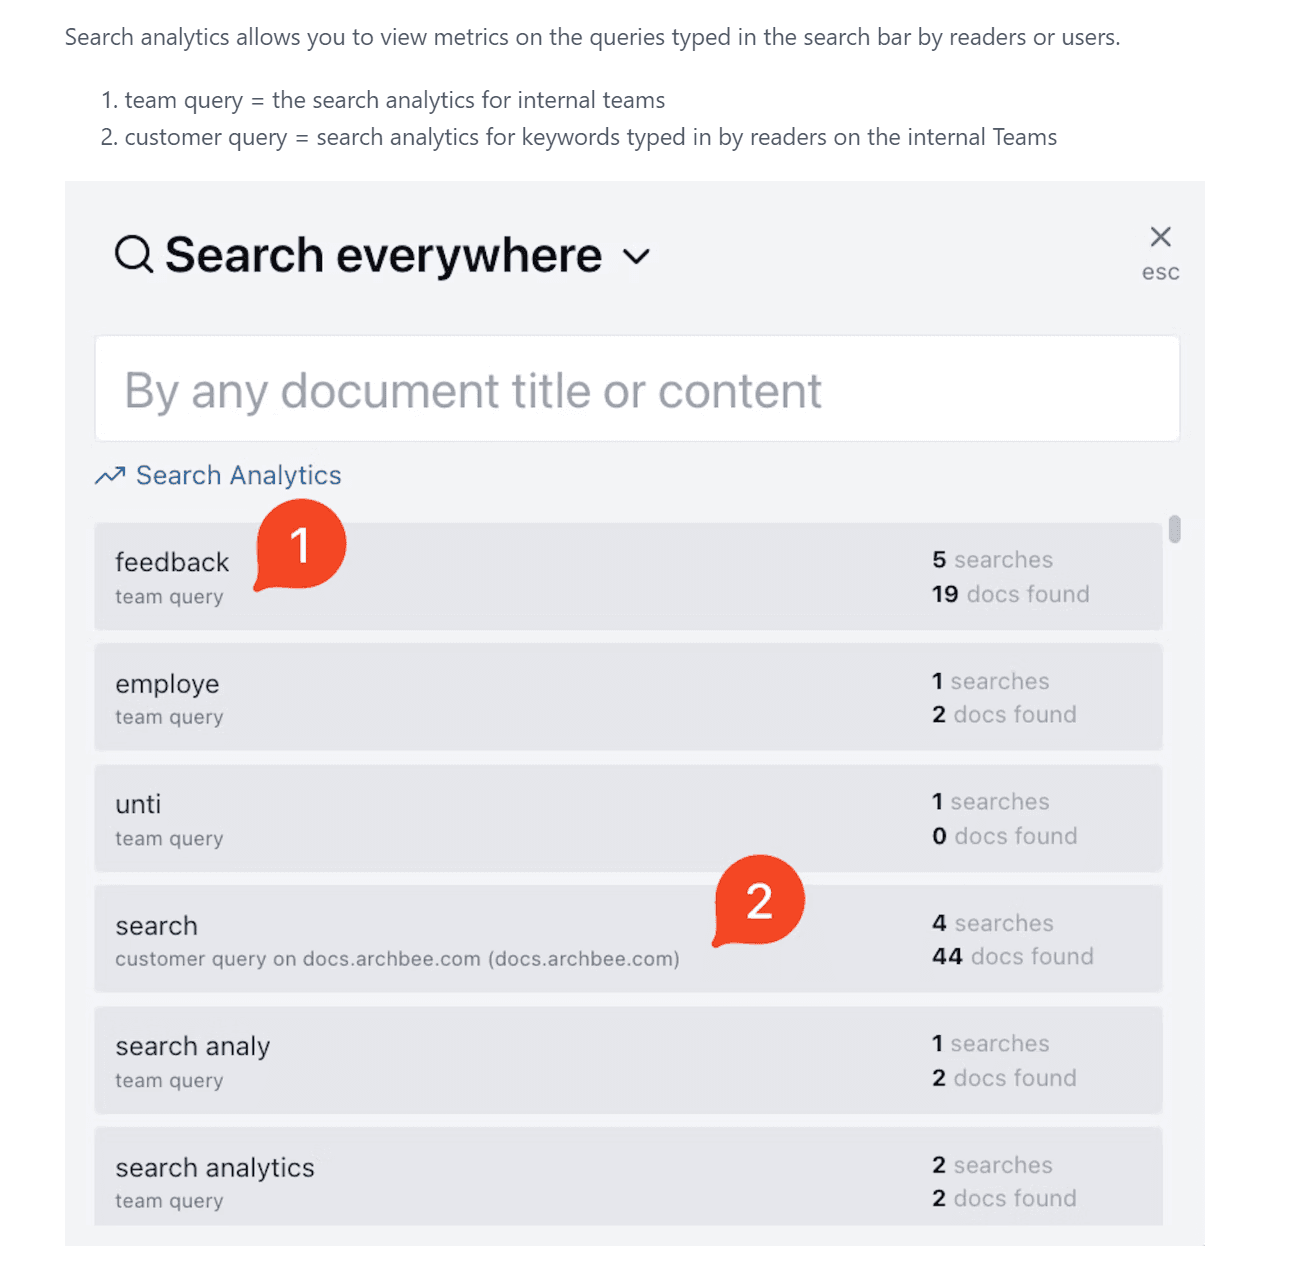
If you’re operating a product knowledge base as a self-service support option, don’t forget to have a look at the keywords users are searching for, as these may point to some education gaps that you can then proceed to fill.
Advanced documentation software such as Archbee will provide you with insight into what users are searching for thanks to integrated search analytics capabilities.
Source: Archbee
A good way to keep support ticket volume low is by redoubling your efforts to educate customers.
In that way, customer education and support ticket volume are closely linked with ticket volume working as a clear KPI for education.
Customer Satisfaction Score
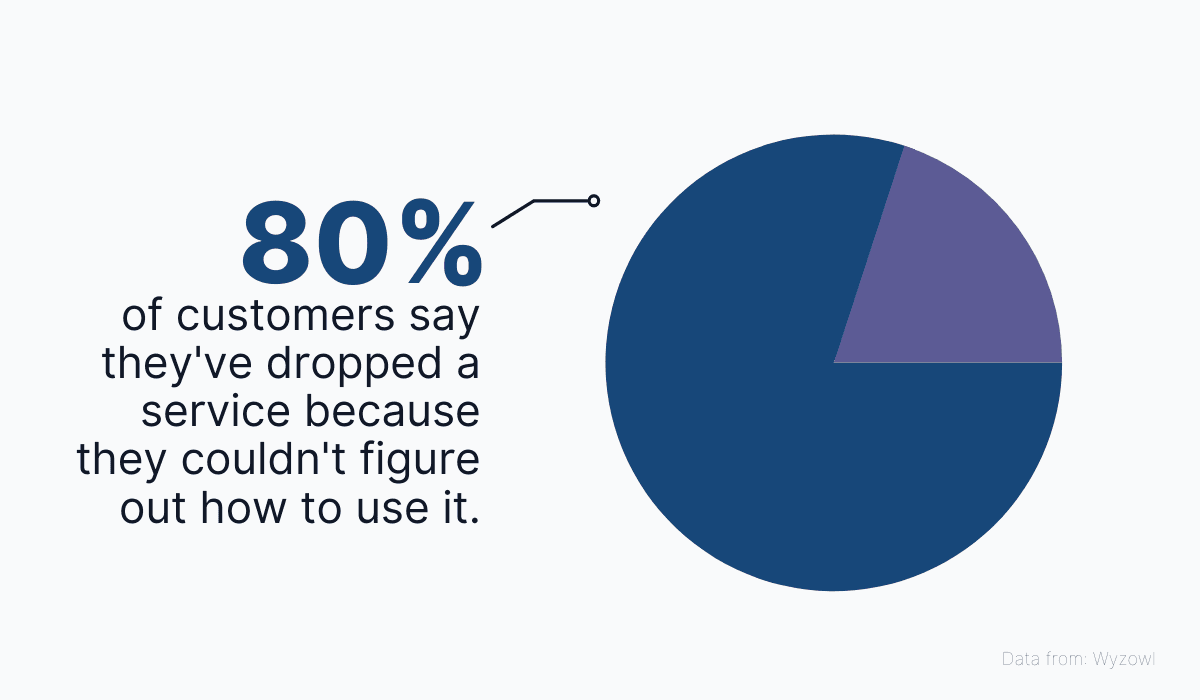
A dissatisfied customer is one that just isn’t able to find value in your product.
Try as they might, they are unable to operate your software and, as a result, decide to abandon it and churn from your service.
This actually happens a lot.
Source: Archbee
But if you can onboard and educate your customers properly, they’ll have no trouble completing their goals quickly and efficiently and that’s going to make them more satisfied with your service.
This shows a link between education and customer satisfaction. So if you’re tracking satisfaction, you’ll be better informed on how well you’re educating customers.
Satisfaction is tracked with a metric called customer satisfaction (CSAT) score.
It’s an interesting measurement because, unlike some of the other metrics in this article, it’s not tracked through analytics but by sending out customer surveys.
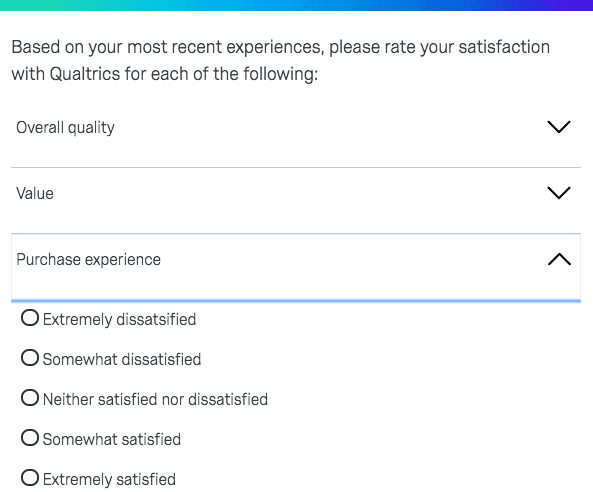
Here’s what Qualtrics' customer satisfaction survey looks like.

Source: Qualtrics
To get a basic customer satisfaction rate, just divide the number of customers who have marked themselves as satisfied (the last two options in the example above) by the total number of survey answers.
Of course, you can gather a lot more data if you complement the survey with more specific questions that enable you to better understand what issues dissatisfied customers are facing.
Source: Qualtrics
If you’re sending a more comprehensive survey, don’t forget to ask users how well your educational programs are working for them.
Inquire about your onboarding process, the level of helpfulness of your support channels, and the effectiveness of the learning process for operating the software.
Keep in mind that a well-educated customer base is a more satisfied one because good product education always results in proper and comfortable product use.
Therefore, a strong CSAT score can be read as a signal that you’re educating customers very well.
Net Promoter Score
This metric is very similar to CSAT, both in character and methodology. The difference is that it asks a slightly different question.
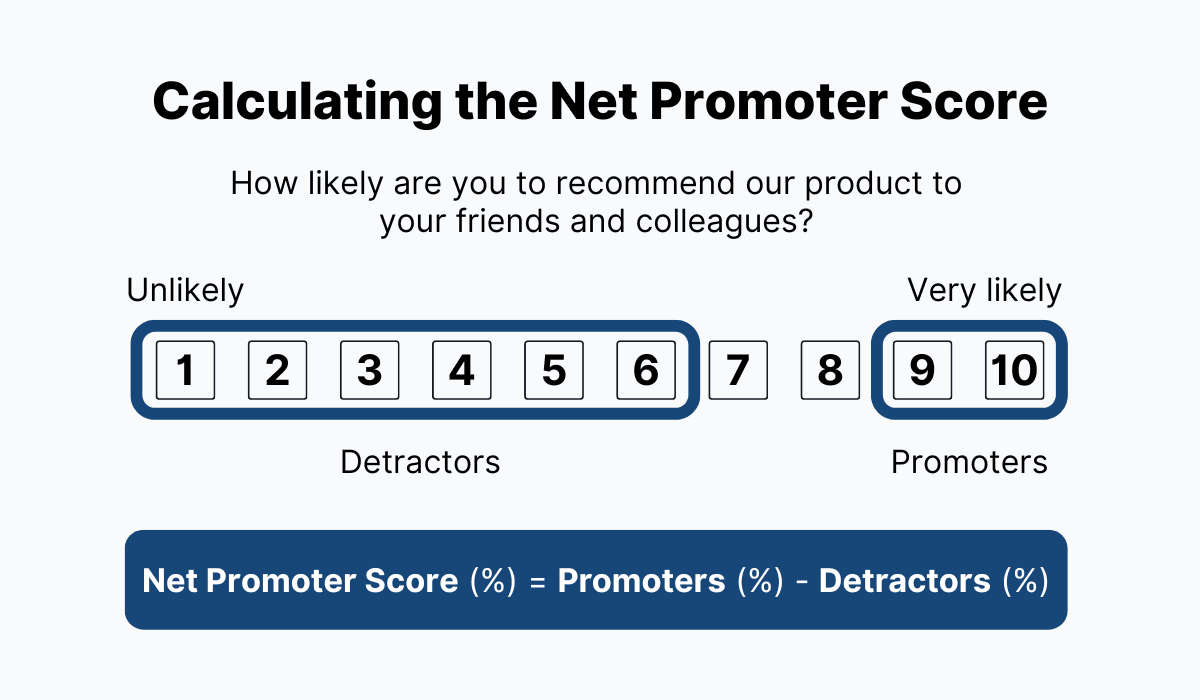
Net promoter score (NPS) measures how likely a customer is to recommend your product or company to others in their social circle. Again the data is collected through customer surveys.
And the way this score is calculated is by detracting the number of users who are unlikely to recommend your service from those who are.
Here’s the formula:
Source: Archbee
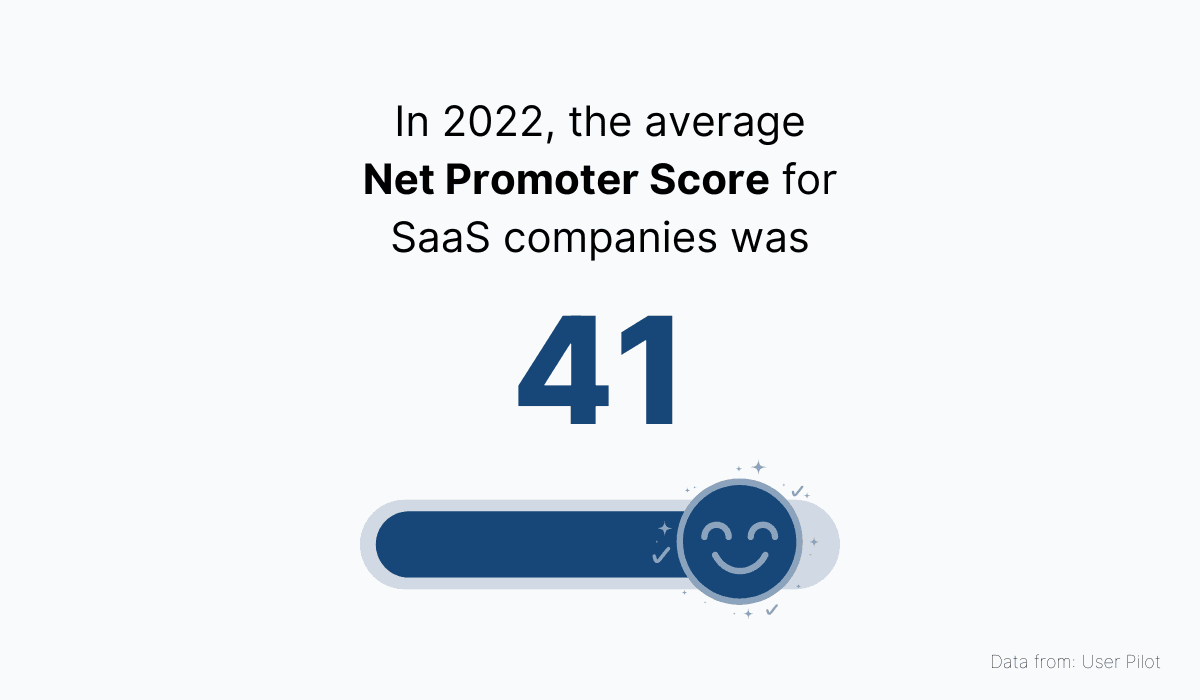
Currently, the average NPS score for SaaS companies is 41.
You can use that figure as a benchmark for your own company’s success in the market and work towards bringing your NPS above the industry average.
Source: Archbee
In SaaS business, NPS is usually understood as the metric of customer loyalty.
That’s because users who are satisfied enough with a product to recommend it to others are very unlikely to abandon the service any time soon.
And as we already mentioned, only well-educated customers have the ability to operate the product successfully and attain their goals with it.
Therefore, your NPS is equally valuable as an education key performance indicator as your CSAT score.
You can use them both to get a more complete picture of how happy your customers are with the product and, therefore, how well you're educating them to use it.
Customer Lifetime Value
In a previous section, we discussed how educating customers can help a SaaS company retain them for a more extended period of time.
In other words, we concluded that education can cause an increase in customer retention rate.
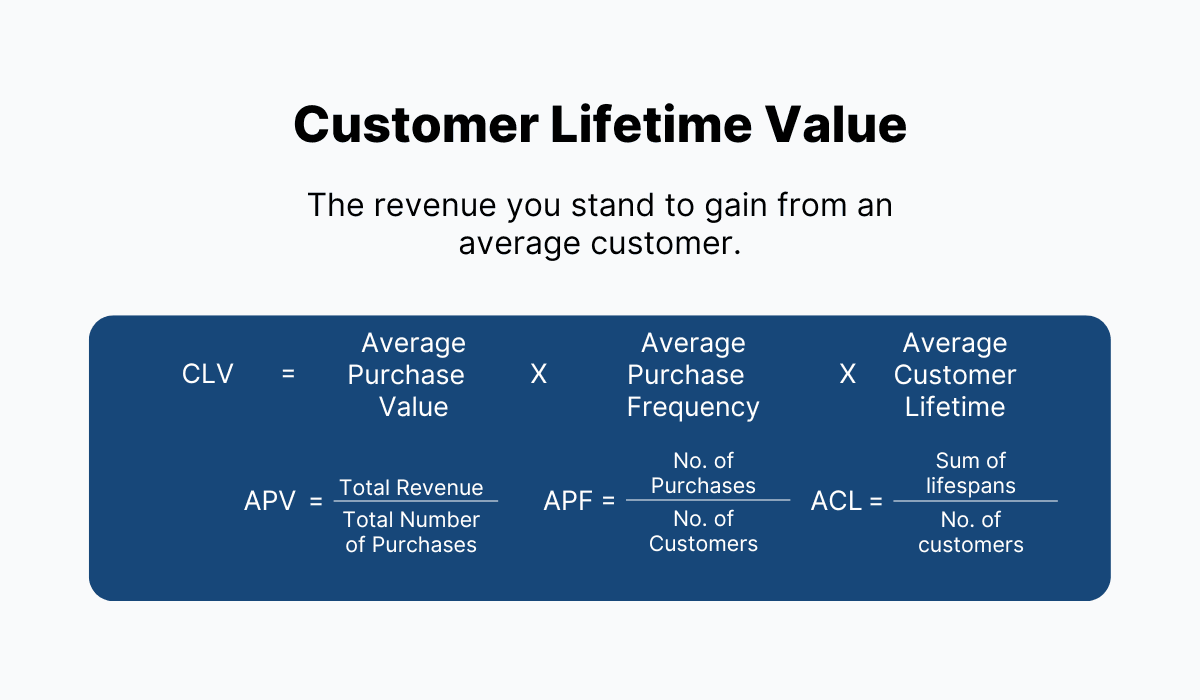
But there’s another way to measure how well you’re retaining customers: customer lifetime value (CLV).
This metric is expressed in the revenue you stand to gain from an average customer.
It’s a little more difficult to calculate, so here’s an overview of the formula:
Source: Archbee
So, in a nutshell, the longer a customer stays with you, the more times their subscription is renewed, meaning you’re getting more revenue out of them.
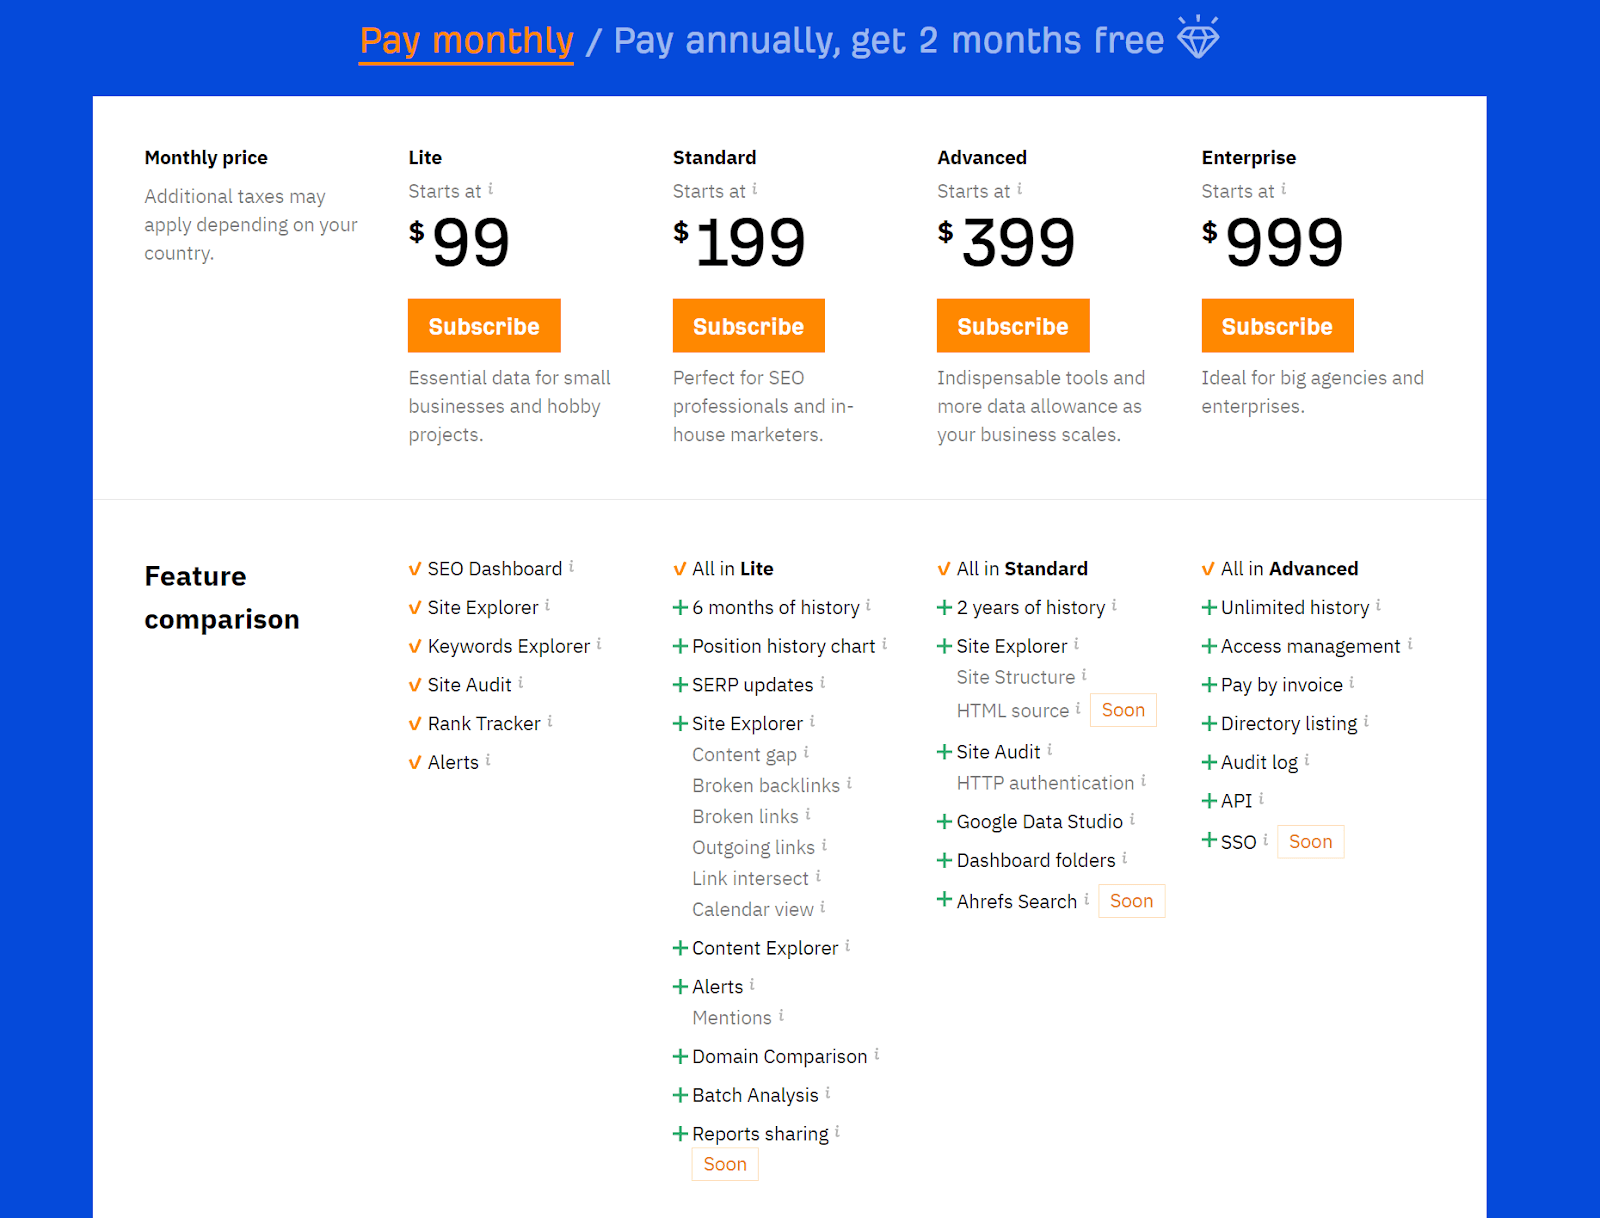
But there’s more. Should a customer decide to upgrade their plan to a more comprehensive service with more features, they’ll have to pay more. As a result, the CLV will increase.
For example, have a look at Ahrefs’ pricing options. Notice that every plan upgrade brings expanded features to enable the user to do more with the software.
Source: Ahrefs
And what kinds of users want to expand their product use and usually decide to upgrade to a more expensive plan?
That’s right. Educated, knowledgeable users who are advanced enough with the product that they feel they can handle a more complex version.
That means that a growing CLV is a direct result of strong customer education practices and, therefore, a clear customer education KPI.
Conclusion
There’s no doubt that customer education can have a direct positive impact on SaaS business, which is why you should never stop investing in it.
However, you should do so intelligently by always keeping track of how well your methods are serving users.
The seven metrics we discussed in this article can function as clear and useful KPIs of customer education, so make sure you’re tracking at least some of them.
Frequently Asked Questions
Because educated customers get value, stay longer, and grow with you.
Here is how strong customer education pays off:
- Faster time to value and correct use Higher onboarding completion and activation
- Deeper, habitual usage Better product adoption and feature adoption
- Fewer support headaches Lower ticket volume and higher self‑service success
- Happier, more loyal customers Better CSAT and NPS, stronger retention
- More revenue over time More renewals, upgrades, expansion, and higher CLV
- Stronger advocacy and feedback More referrals and clearer product insights
To realize this, invest in structured onboarding, in‑app guidance, an up‑to‑date knowledge base, webinars or an academy, and proactive customer success. Track the KPIs above to prove impact and guide improvements.
